The Lunar Reconnaissance Orbiter (LRO) spacecraft explores the Moon using seven scientific instruments. These include the LRO Camera (LROC) package, which is, of course, the instrument we highlight in these Featured Images. The seven instruments collect different kinds of scientific data. Combining their data sets allows scientists to make discoveries they never could if they were limited to a single lunar-orbiting instrument.
Since 2009, the heat-sensing Diviner Lunar Radiometer Experiment on LRO has systematically mapped the Moon's surface temperatures, enabling reseachers to chart more than 2200 anomalous cold spots between 50° N and 50° S latitude. The cold spot anomalies appear after the Sun goes down.
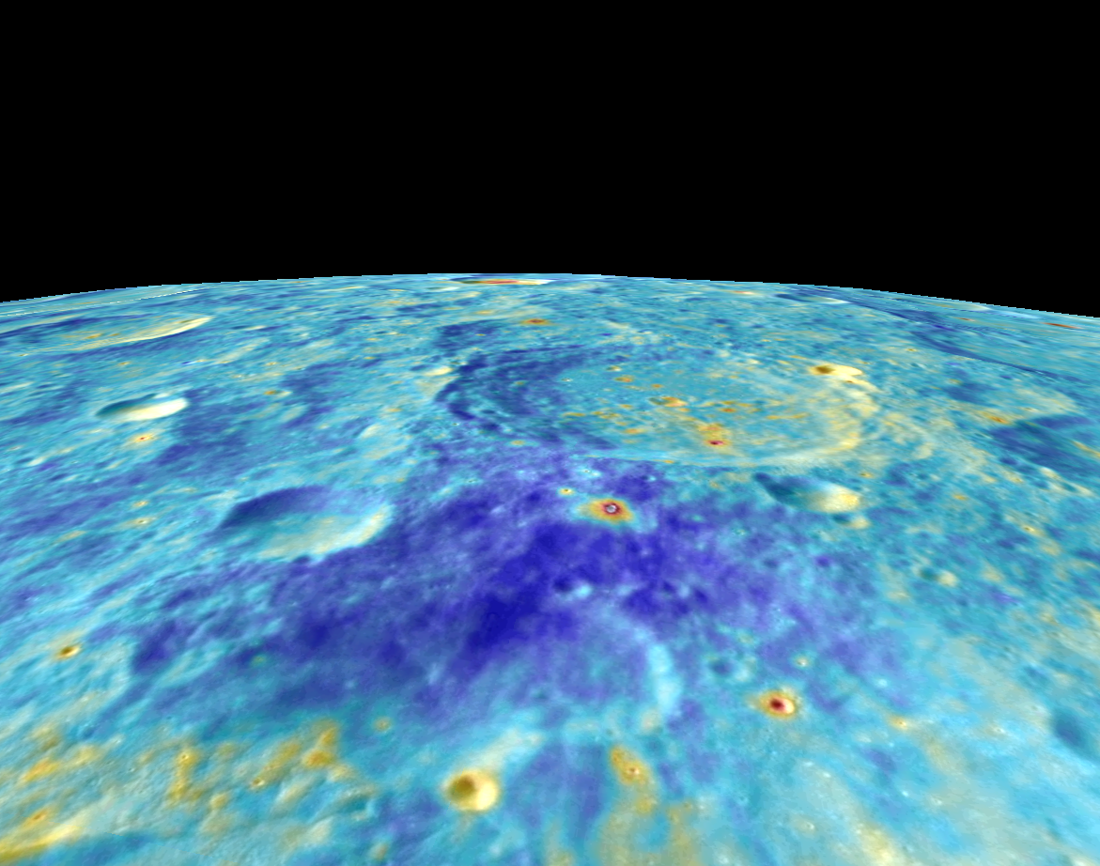
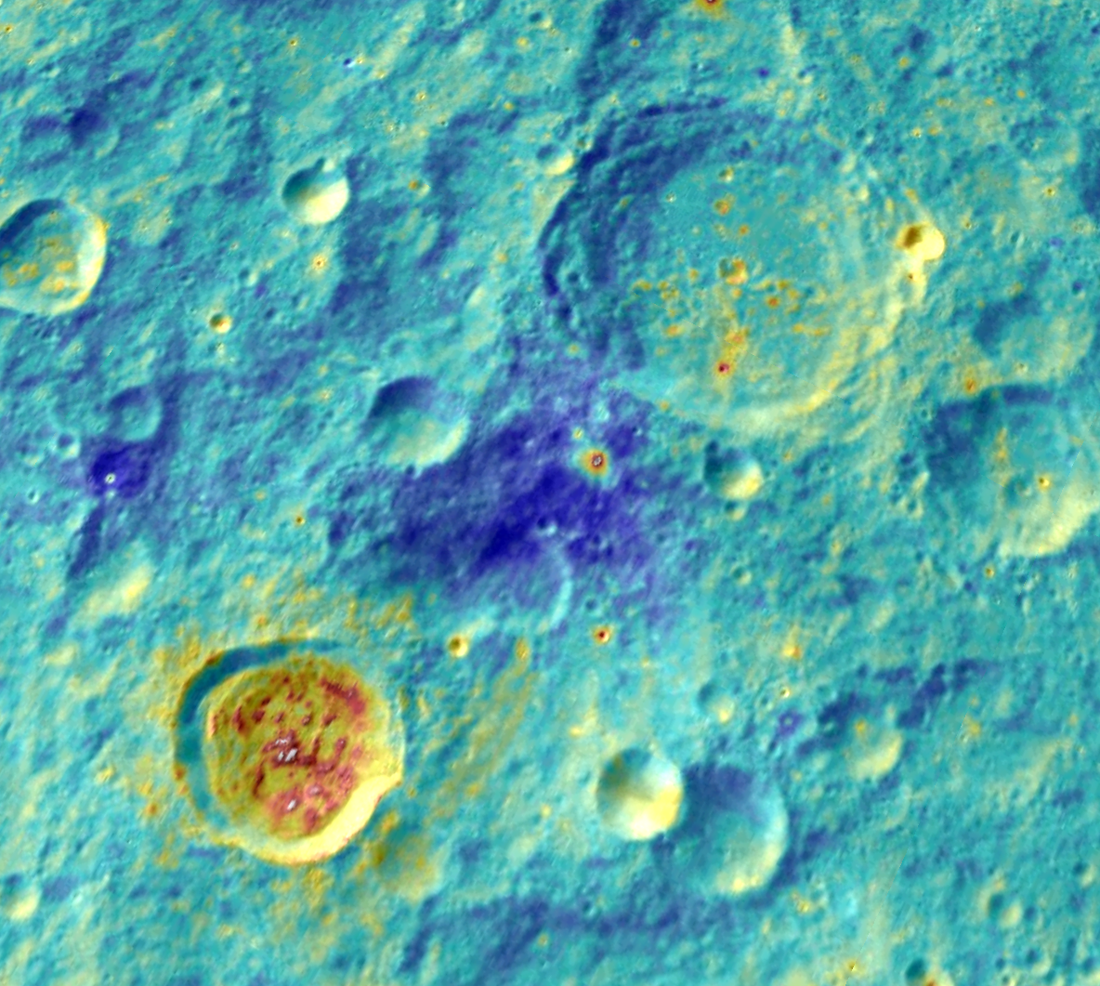
The Diviner instrument sees the cold spots as irregular splotches that rapidly radiate heat after sunset until they are up to 10° Fahrenheit colder than the surrounding landscape. LROC, observing in the visible part of the spectrum, sees nothing unusual at cold spot locations. When the Sun rises, the spots rapidly warm to the temperature of their surroundings and blend in with the background.
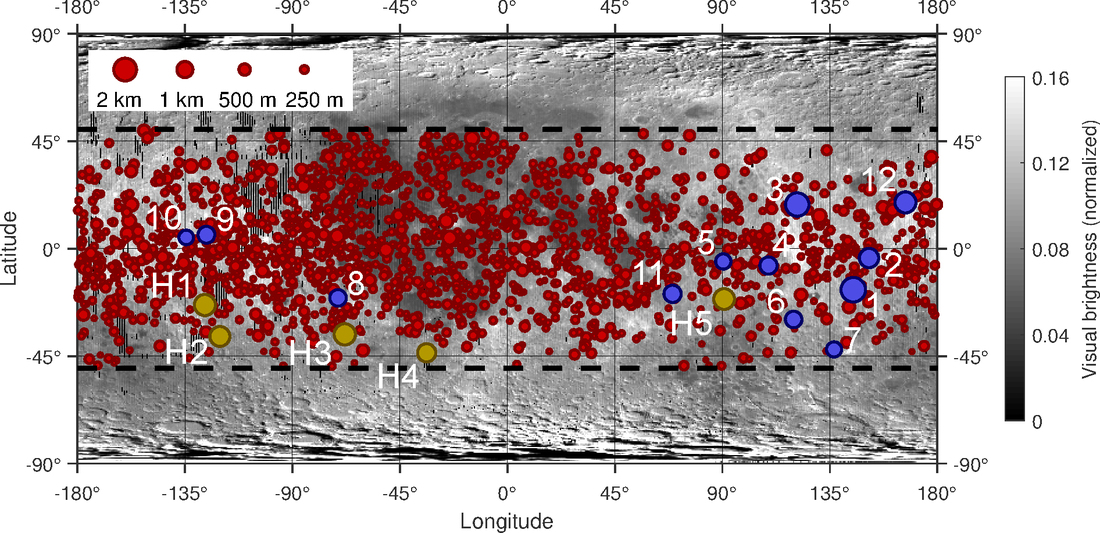
What causes cold spot anomalies? In most cases, Diviner data are of too low a resolution to confirm a source. When Diviner data are overlaid on higher-resolution LROC images, however, researchers find that almost all occur around impact craters that are young (less than one million years) and small (from 43 meters to 2300 meters across).
We know the craters are young because they have very rocky floors and rims and are surrounded by bright rays. The steady infall of debris from space has not yet had time to chip away these signs of youth. This leads researchers to conclude that a process related to the formation of small craters creates the cold spot anomalies. But what process?
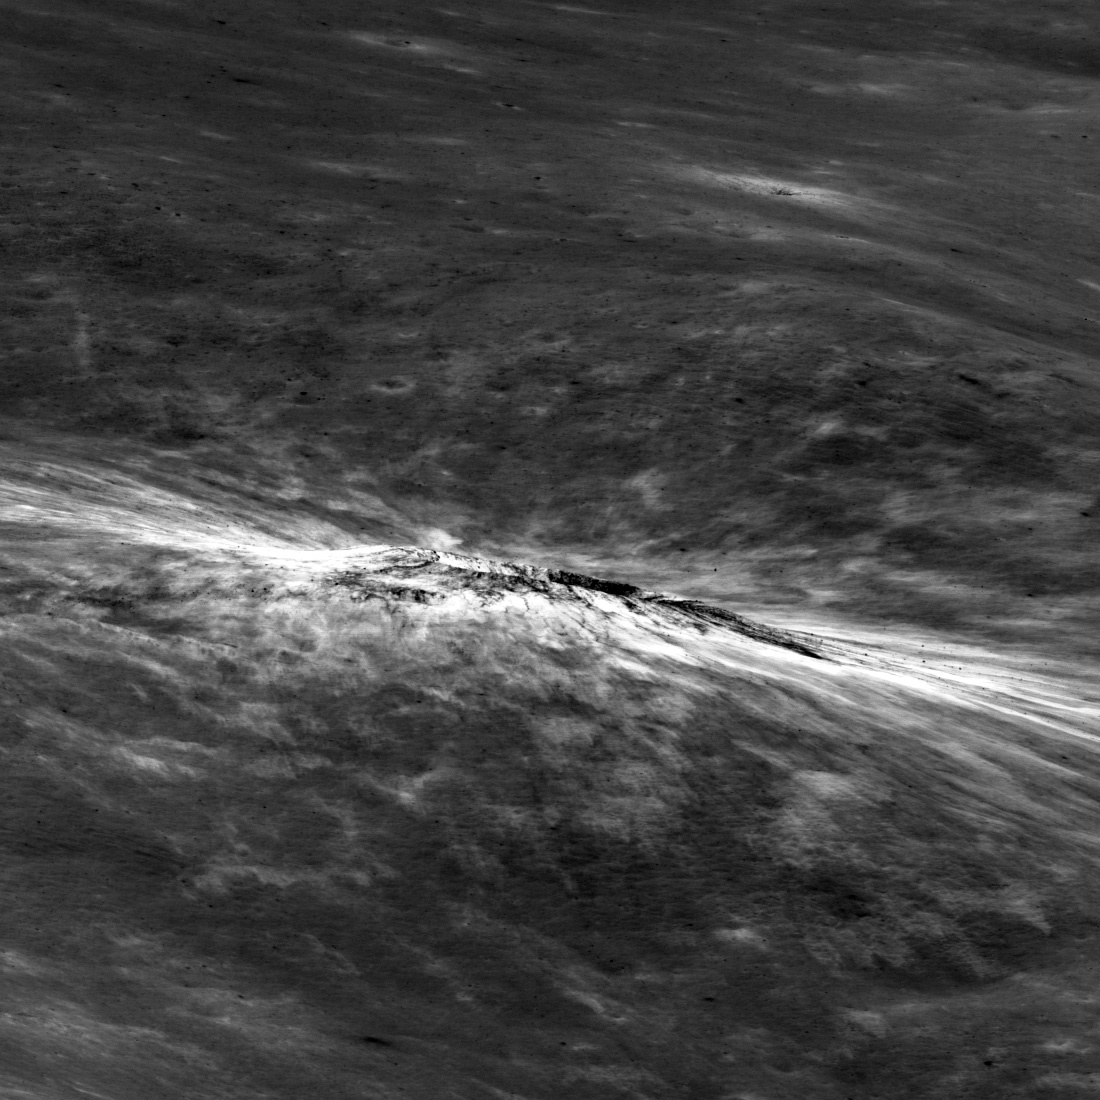
Einthoven cold spot crater, the subject of today's Featured Image, is 1143 m wide, or about the size of Meteor Crater in Arizona. So far, it has no official name — we call it Einthoven cold spot crater because it is just south of Einthoven crater, which is old, degraded, and, at 69 kilometers in diameter, the largest crater in the neighborhood.
Though craters associated with cold spot anomalies are small, the cold spots themselves are often large. The Einthoven cold spot crater anomaly takes in 2070 square kilometers of terrain and extends up to 50 kilometers from the crater. That's much too large an area for ejecta from the crater to cover, which eliminates the most obvious cold spot formation hypothesis: that material blasted from the crater during its formation could create the cold spot.
So, how to explain the cold spot anomalies? Some researchers invoke a cascading series of tiny secondary impacts traveling outward from the crater-forming asteroid impact, while others believe that gas produced by the impact flows through the top layer of lunar surface material. Either process might "fluff up" the surface, changing the way heat affects it. Few researchers, however, find these explanations to be 100% convincing.
Be sure to examine the Einthoven cold spot in the images below and follow the links to scientific papers about on-going efforts to solve the cold spot mystery!
Related Featured Images
Ejecta Sweeps the Surface Albedo contrast in the ejecta around a roughly one-kilometer-wide young crater in the Sea of Tranquility
Dynamic Textures The ejecta blanket around a young 1.1-kilometer crater resembles a furrowed farm field
Ka-Pow! Complex ejecta patterns around a 650-meter young crater in 164-kilometerJoliot crater
Minty Fresh A 330-meter young farside crater with complex rays
Dynamic Moon! LROC reached the Moon in 2009 — by imaging the same places repeatedly over the years and comparing the images we've discovered many new small craters and dark "splotches"
Scientific Papers on Lunar Cold Spots
Mendell, W. W., and Low, F. J. (1975), "Infrared Orbital Mapping of Lunar Features," Proc. Lunar Sci. Conf. 6th, 2711-2719 https://www.researchgate.net/publication/23924054_Infrared_orbital_mapping_of_lunar_features
Bandfield, J. L., Ghent, R. R., Vasavada, A. R., Paige, D. A., Lawrence, S. J., Robinson, M. S. (2011), "Lunar Rock Abundance and Regolith Fines Derived From LRO Diviner Radiometer Data," Journal of Geophysical Research, 116, E00H02 https://agupubs.onlinelibrary.wiley.com/doi/full/10.1029/2011JE003866
Bandfield, J. L,, Song, E., Hayne, P. O., Brand, B. D., Ghent, R. R., Vasavada, A. R., Paige, D. A. (2014), "Lunar Cold Spots: Granular Flow Features and Extensive Insulating Materials Surrounding Young Craters," Icarus, 231, 221-231 https://pdfs.semanticscholar.org/49fb/c505b271f4dd57c5b30eaa4e4c9722ec2111.pdf?_ga=2.86897880.1912966133.1534358829-923306937.1534358829
Williams, J.-P., Paige, D. A., Greenhagen, B. T., Sefton-Nash, E. (2017), "The Global Surface Temperatures of the Moon as Measured by the Diviner Lunar Radiometer Experiment," Icarus, 283, 300-325 https://www.sciencedirect.com/science/article/pii/S0019103516304869
Williams, J.-P., Bandfield, J. L., Paige, D. A., Powell, T., Greenhagen, B. T., Taylor, S., Hayne, P. O., Speyerer, E. J., Ghent, R. R., Costello, E. S. (2018), "Lunar Cold Spots and Crater Production on Moon," Journal of Geophysical Research, in press http://adsabs.harvard.edu/abs/2016DPS....4821505W
Published by David Portree on 21 August 2018