The lunar surface is peppered with craters that formed over time - and we know that impact craters still form to this day. A process that slowly and relentlessly reshapes the Moon's topography. Comparative study of the shapes of lunar craters helps scientists understand how the surface evolves with time. At first glance, impact craters generally look the same. However, in reality, each crater is unique in its own way, and over geologic time, will change in shape. By examining shapes of many craters we set out to determine if it is possible to mathematically model how craters degrade with time. Eventually, this effort might help scientists estimate the age of a single crater based simply on its topography.
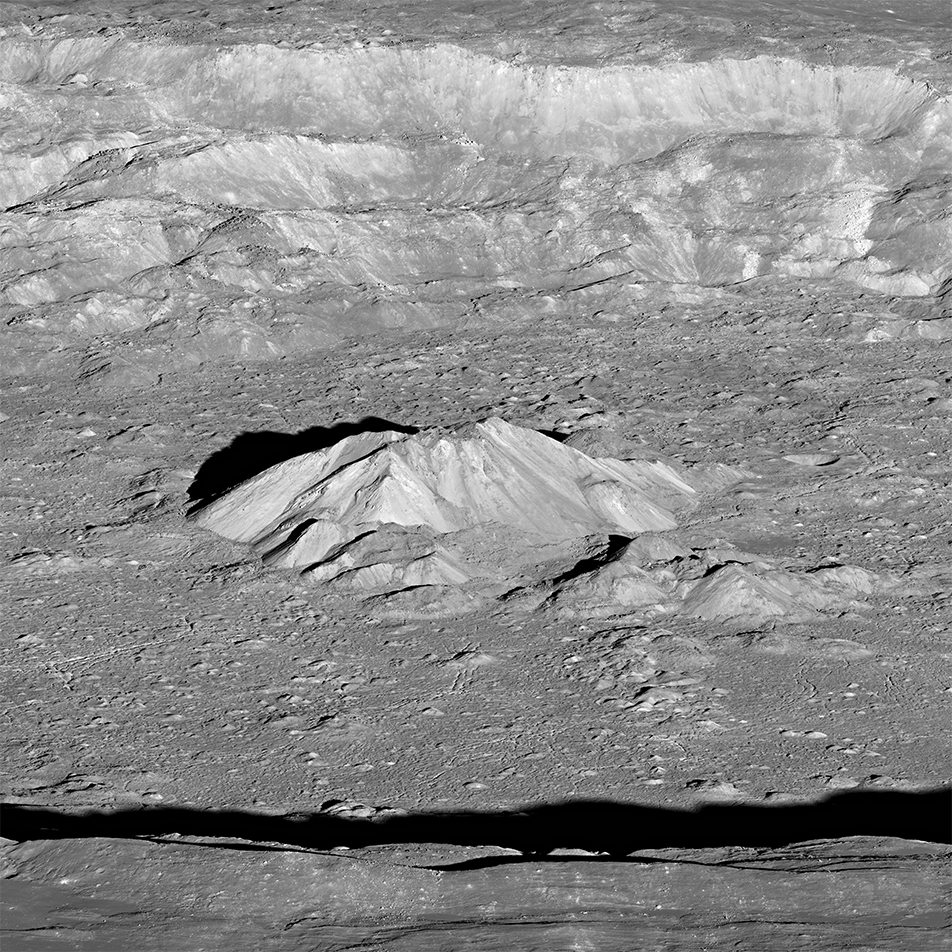
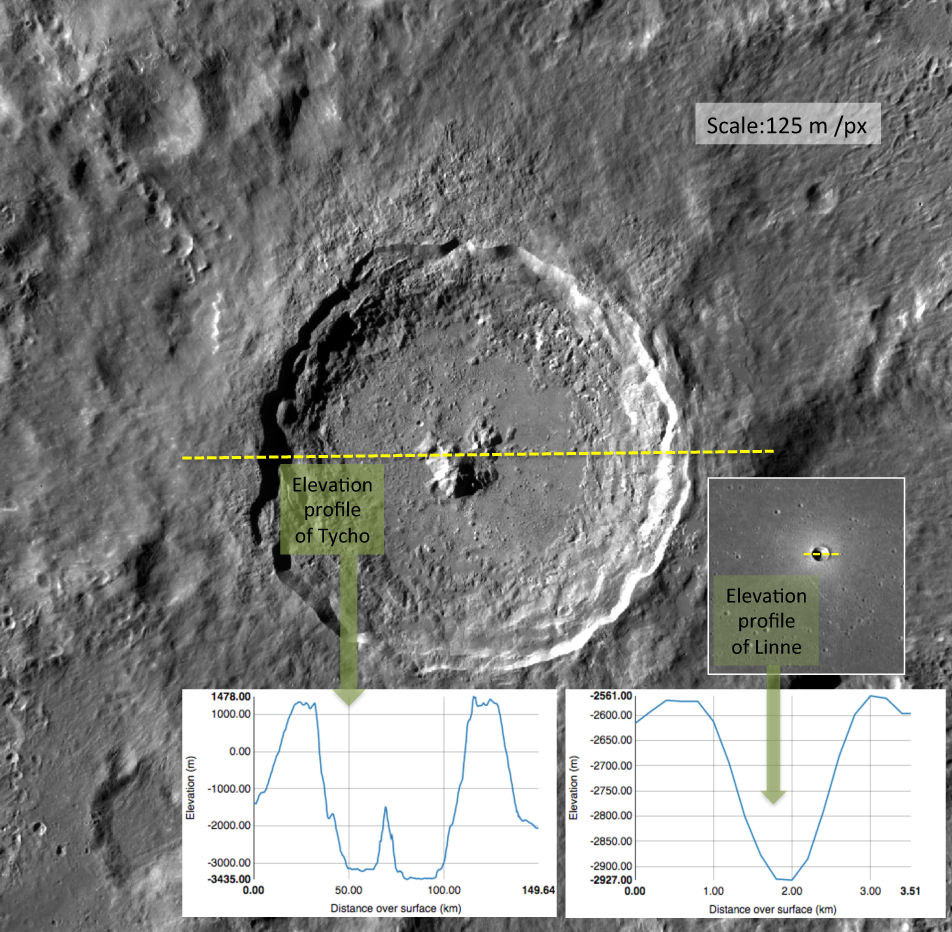
In many past studies, crater depth and diameter were the most common measurements for describing crater shape. However, these two simple measures do not come close to fully describing the detailed shape of a crater. For example, Tycho (above) and Linné are familiar lunar craters, with very different shapes. LROC images and elevation profiles (elevation values along a line drawn through the crater) emphasize the differences in their shapes. Tycho is the larger and rougher crater, while Linné is more radially symmetric and has no central peak.
High-resolution topographic data make it possible to compare shapes at fine scales. In particular, LROC NAC topographic maps (known as digital terrain models, or DTMs) are the best available data sets to evaluate the shapes of lunar craters. As more DTMs become available, more craters can be compared.
Quantifying Crater Shapes
In the example above, we qualitatively contrasted two craters that are very different from each other, but how can a precise, quantitative comparison be derived? And how can we quantify and compare the topography of a large number of craters (or perhaps even some day all lunar craters)?
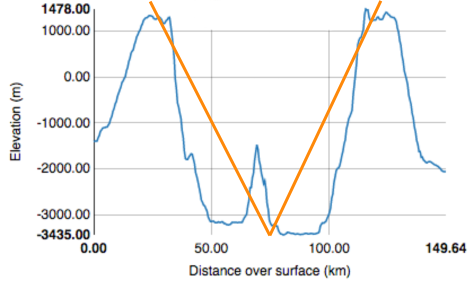
The answer lies in geometry. The simplest geometric description of a crater elevation profile is two straight lines meeting at an angle in the bottom of the crater, making a "V" shape. The length of the lines, and the angle between them, represents a cone in three dimensions. Since most craters are roughly radially symmetric, a single 2-dimensional profile through the center of a crater is a good representation of its three dimensional topography. However, a cone is not a very satisfying simplification for complex craters like Tycho. If a "V" is drawn over the profile of Tycho, it would not represent the shape of the crater (below).
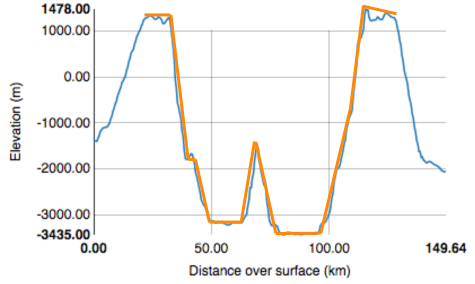
At larger and larger diameters crater shapes become more complex and their profiles are better represented by a series of shorter line segments (shown below). Ultimately, a sequence of curved lines provides the closest match to the crater's elevation profile.
Line segments (straight or curved) can be represented as mathematical expressions. Thus, craters can also be represented by mathematical expressions. To quantitatively compare the shapes of a large number of craters, we can compare the parameters of their mathematical representations. Mathematical expressions can have few parameters (as in y=x+5), or many parameters. The mathematical representation must work for all craters and should be relatively easy to obtain and interpret. Polynomial functions, for example, offer a method of representing crater shapes in fine detail (with a good fit to the elevation profile). A polynomial function is a mathematical expression consisting of variables and coefficients (for example, 3 is a coefficient of x2 in the polynomial function y=3x2+x). Among many polynomials, we found the Chebyshev polynomials to be particularly suited to successfully describe crater shapes.
Chebyshev Coefficients
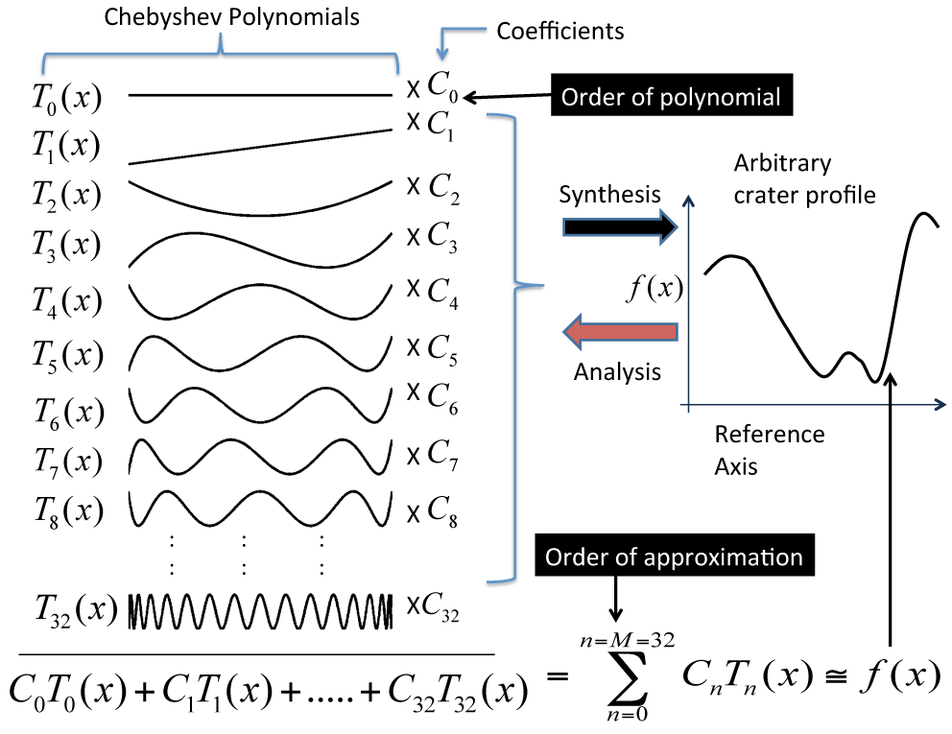
We found that the topography of nearly all lunar craters can be represented by a relatively small set of the Chebyshev polynomials (a subset is shown below). In this representation, the individual polynomial functions are scaled and summed to approximate the actual crater elevation profile. The scaling factors are the Chebyshev coefficients.
The individual Chebyshev functions each represent a component of the overall crater shape (such as, part of the crater rim, wall, or floor) and, combined with the corresponding coefficients, describes a particular crater. Thus only the coefficients change from crater to crater, allowing the creation of a vast and highly precise database of lunar crater shapes!
The figure below shows how the Chebyshev coefficients are used to interpret crater shapes for Tycho and Linné craters, which we qualitatively described earlier.
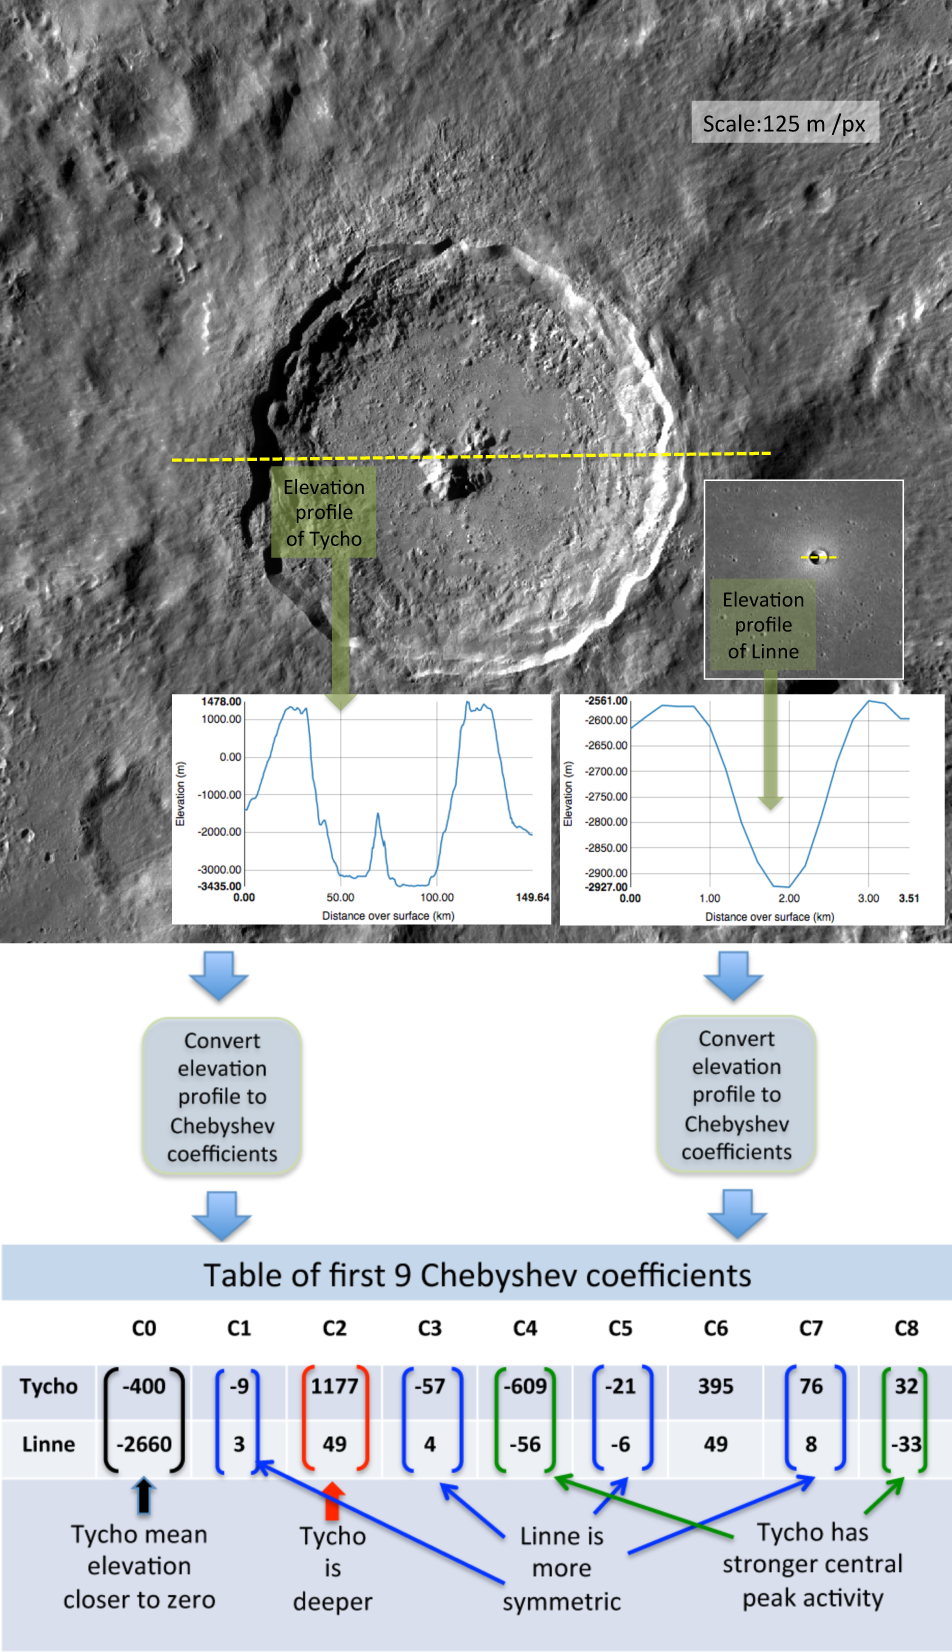
The topography of a lunar crater is initially a result of a random impact event followed by eons of relentless erosion, mostly by the cumulative effect of micro- and macro-meteorite bombardment, and seismic shaking. As a result it is not surprising that the topography of most lunar craters can be mathematically approximated with only 17 Chebyshev coefficients. By selectively multiplying the coefficients corresponding to one crater, we can estimate how it looked in the past or predict how that crater will look in the future. This mathematical description could also be used to make a realistic synthetic lunar landscape – perhaps for a computer game or a CGI movie.
The next step in this story is to collect topographic profiles from thousands of lunar craters and compute their Chebyshev coefficients. With this new large dataset and analytical technique, we can gain an improved understanding of the range of crater shapes, how craters degrade over time, the relative ages of craters, and perhaps even absolute ages. Stay tuned as this fascinating work proceeds!
For more details on using Chebyshev polynomials to investigate crater shapes see: A standardized approach for quantitative characterization of impact crater topography (Mahanti, P. et al., 2014, Icarus v. 241, p. 114–129).
Related Featured Images
Tycho Central Peak Spectacular!
Published by Mark Robinson on 28 May 2015