Impact crater density has long been used as an indicator of the relative ages of surface units on the Moon – older surfaces have had a longer amount of time to accumulate craters as asteroids and comets battered the surface for millions and even billions of years. Areal crater density also provides direct evidence of resurfacing events that altered the crater populations. For example, volcanic flooding could bury all craters below a certain size, while leaving larger craters still visible, or the formation of a large, young impact basin could erase every crater that came before it within its interior and nearby ejecta.
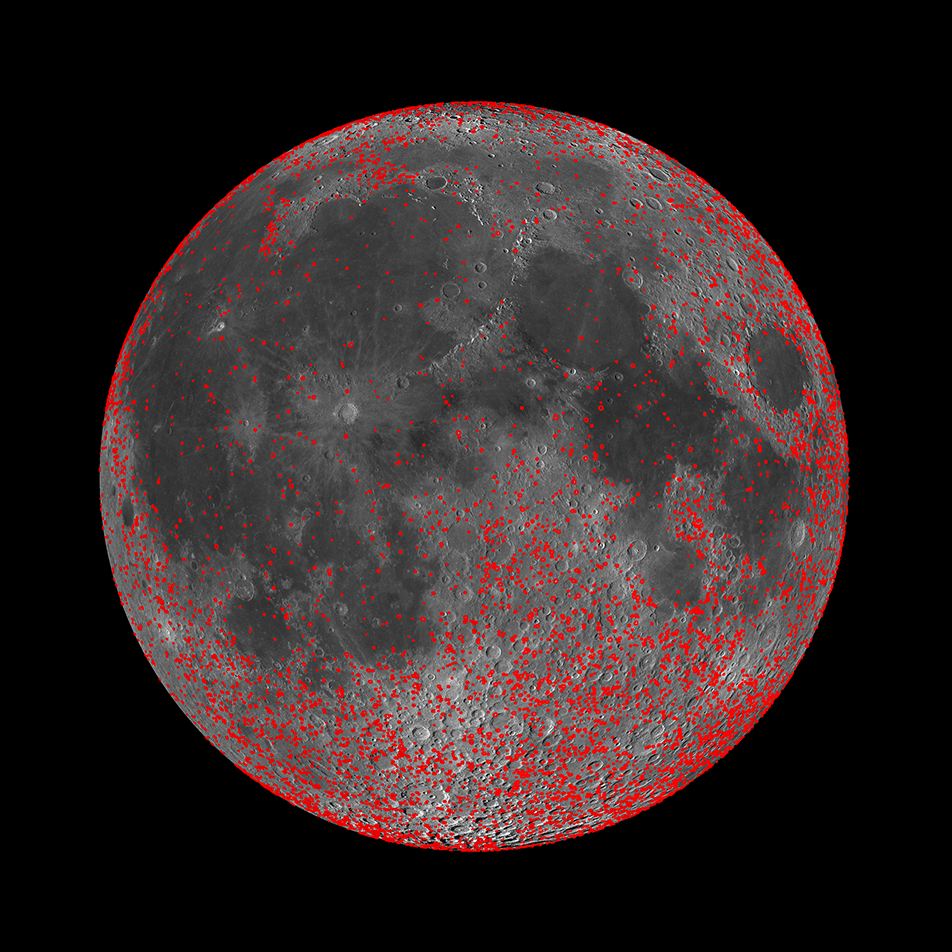
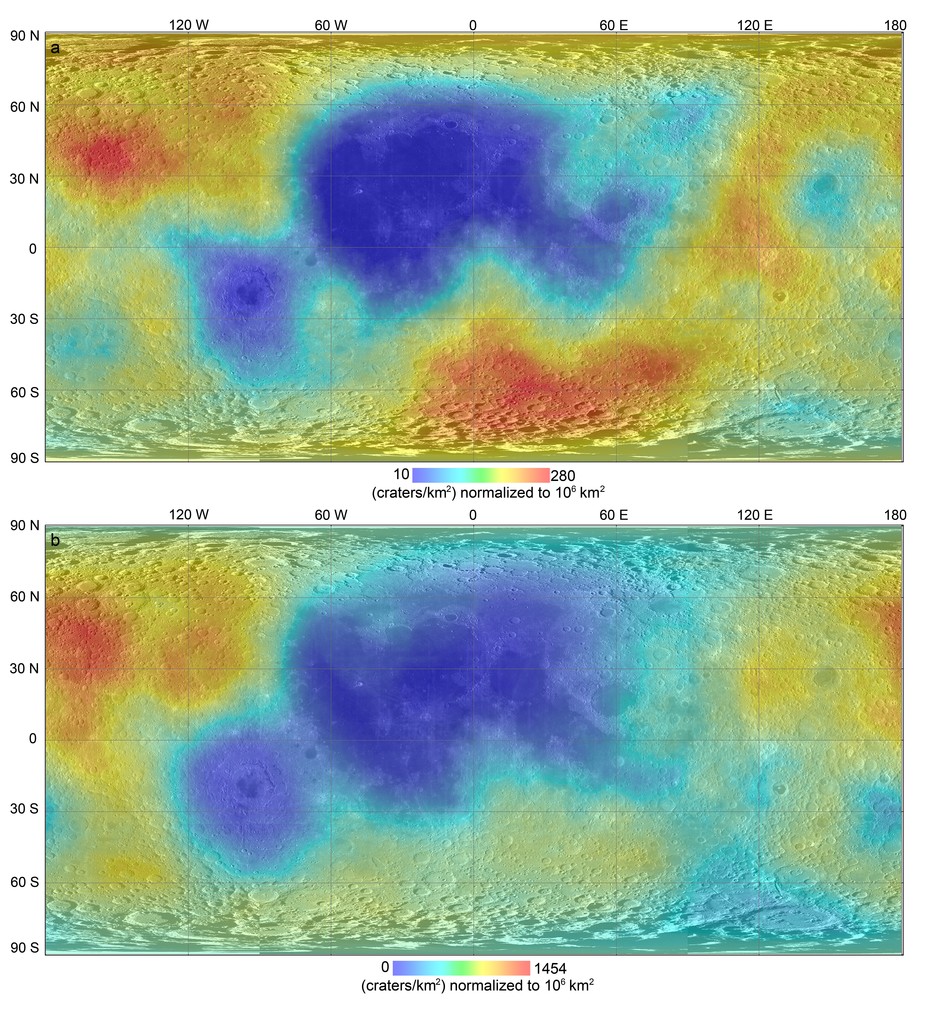
Previously, the location and size all identifiable craters larger than 20 kilometers in diameter was documented [Head et al, 2010] – around 5,000 craters in total. In new work from the LROC team, all craters 5–20 km were identified: over 20,000 additional craters! From these two maps of of lunar craters, we can calculate the areal crater density by determining the number of craters in a certain size range within a specific area (e.g. craters per million square kilometers). The images below show the density of craters greater than or equal to 20 km in diameter, and those between 5 and 20 km in diameter.
Overall the maps are similar, but subtle variations reveal differences in geologic processes that have worked to alter the crater population across the Moon. These distinct areas are better revealed in a difference map created by taking the top map in the figure above (density of craters >20 km in diameter) and subtracting the bottom map in the figure above (density of crater 5–20 km in diameter). The result is the map below, where reds and yellows indicate a relative lack of smaller craters; blues indicate areas where there is a relative excess of small craters.
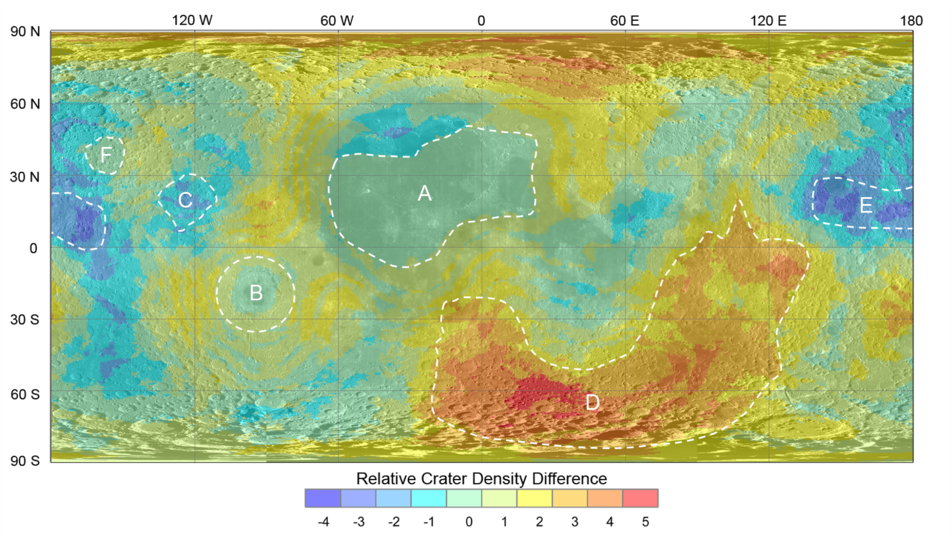
In this difference map, six areas stand out:
Area A: The formation of the lunar mare resulted from widespread basaltic flooding; these volcanic deposits buried craters of all sizes >5 km.
Area B: The Orientale impact event destroyed pre-existing craters up to at least 63 km in diameter within the basin itself.
Area C: Distinctive chains of 5-20 km secondary craters that were created when ejecta from the Orientale event impacted the surface farther away.
Area D: An abundance of >20 km craters and 5–20 km craters resurfaced in Mare Australe.
Area E: A high abundance of 5–20 km craters, possibly secondary craters created by basin ejecta.
Area F: High density of all craters >5 km, possibly due to a lack of resurfacing events.
Together these areas of varying crater density show the unique history of each location on the Moon, whether it was scarred by basin ejecta, flooded with volcanism, or obliterated by a large impact event (or sometimes all three). The crater density maps were also used to show that some areas of the Moon have experienced such a long history of impact bombardment, and are so filled with impact craters, that on average for every one new crater that forms, one of the same size is destroyed. This phenomenon is called crater "equilibrium" or "saturation equilibrium." The crater diameter at which saturation equilibrium occurs depends on the age of the surface – younger surfaces exhibit saturation equilibrium only at small crater diameters, whereas larger craters on older surfaces may reach equilibrium. This new crater map was used to show that saturation equilibrium exists for craters below diameters of 50 to 160 km in diameter for widespread regions of the Moon.
Related featured images:
Published by Brett Denevi on 13 November 2017